Adokforme wrote: ↑Tue Apr 08, 2025 9:38 pm
by Mart » Mon Apr 07, 2025 6:56 pm
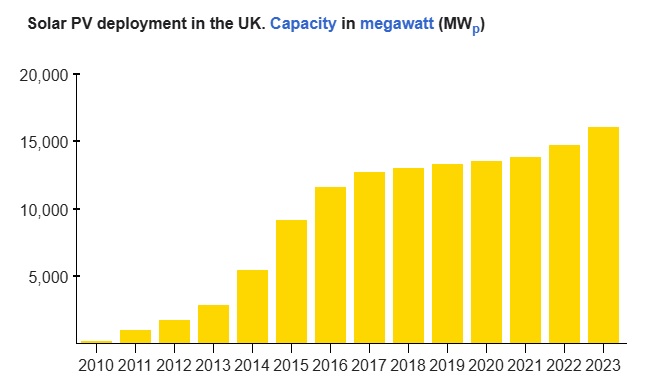
Yep, that's the way I read the solar and other figures, and I think the figure is an estimate of all grid connected PV. Wind has risen from ~2GW to ~10GW.
It's all rather depressing when compared to other countries progress in the last decade but with panel prices now at an all time low in combination with the US throwing tariffs around to all and sundry just maybe we can benefit and begin playing catch up in the coming months and years ahead. Admittedly we can't change weather patterns but we can at least take advantage from the sushine hours offered.
Just thinking about the new PV record output reached twice in the last week then with another 10 weeks to the longest day I wonder how many more times it may be surpassed.
This last week our array has hit daily figures of about 85% of the max enjoyed in a normal year. Could there be another 15% nationally still to come!
Good news though, is that according to iamkate again, average demand in 2012 was 36.5GW, and 2024 it was 30.1GW. So solar has risen from 0.38% (0.14GW) to 5% (1.51GW). Not sure if that's cheating, so let's just compare both generation figures against 2024 demand, so 0.47 to 5%, a 10x improvement.
We absolutely could have, and should have done better, but perhaps given high PV costs, and relatively poor sun, going in on wind (more) first has worked out. But I'll be disappointed if the UK doesn't start pushing PV much harder, both supply and demand side. The last CfD auction actually had PV prices beating on-shore and off-shore wind, but admittedly still much higher than off-shore wind a few years ago, before the Ukraine/gas impact on energy, steel, transport etc hit it much harder than average inflation.