The only way I can get to it is by following a sequence of opening different windows without closing any as follows:-
1/ Solax - Overview - Click the text link to the 'Site Name' roughly in the middle of the window, which opens a new window with headings of Site Analysis/Device Matrix/Statistic Report.
2/ Switch back to the Solax - Overview tab, then from the left hand menu select Device, then Inverter. Click the link in orange text of the Inverter SN. A new windows opens with headings of Inverter Analysis/Alarm History/Inverter Data/Statistic Report.
Choose Inverter Data
You end up with 3 tabs open in the web browser.
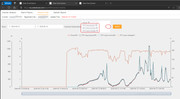
3/ By default only Power is displayed in the graph, but you can also select different paramaters as shown in screen grab below.