
May:
Solar: 462 kWh
Consumption: 380 kWh
System Efficiency: 82%
Battery Efficiency to Date: Discharged 1,322 kWh / Charged 1,376 kWh = 96%
Last Month (April):
Solar: 680 kWh
Consumption: 577kWh
System efficiency: 85%
May 2024 generation
Re: May 2024 generation
38m Barge, Solar (10.6 kWp), 26 kWh of LFP, 50kWh Akvaterm Thermal Store (750l)
Victron Quattro 8 kVA, CerboGX, 3,500L STP, 57kVa Perkins
Our live data: https://vrm.victronenergy.com/installat ... e/c76c4bf6
Victron Quattro 8 kVA, CerboGX, 3,500L STP, 57kVa Perkins
Our live data: https://vrm.victronenergy.com/installat ... e/c76c4bf6
Re: May 2024 generation
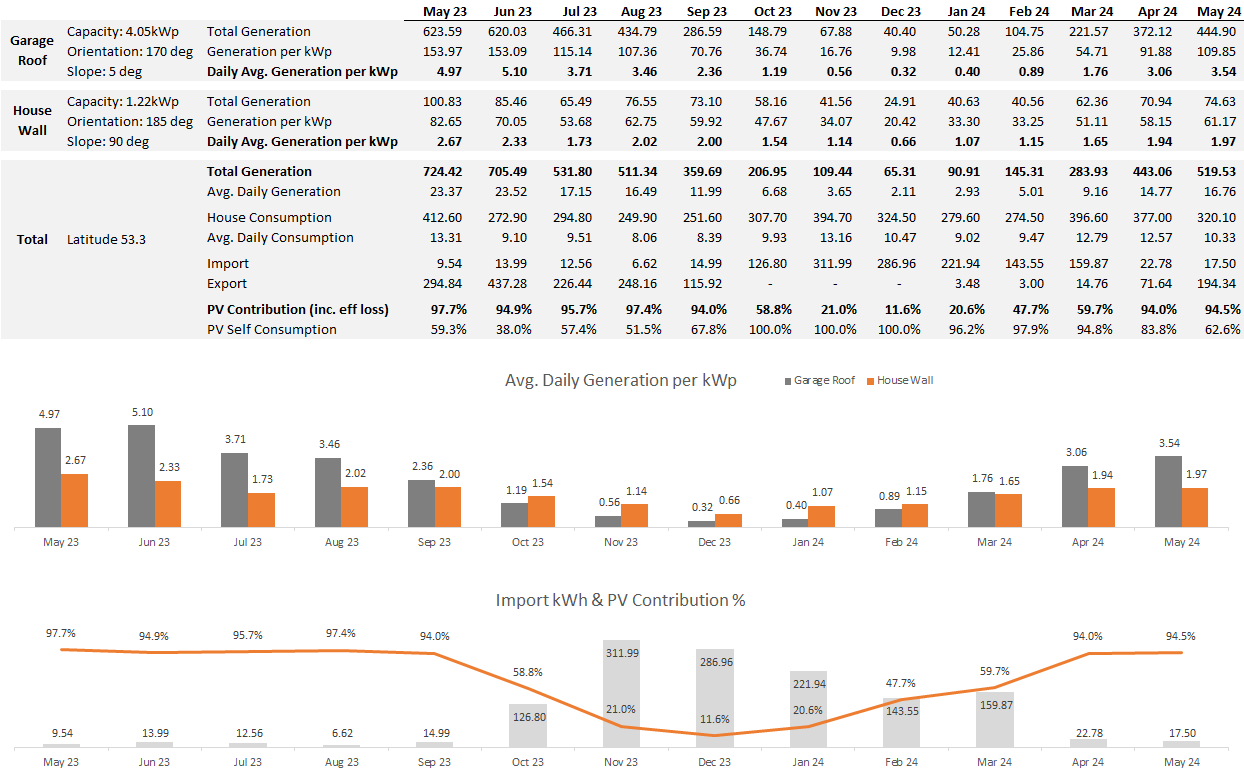
A very different month compared to 2023, over 200kWh down vs 12 months ago. It was poor enough that grid charging was needed on one occasion.
Best day was 29.55kWh (31.29kWh in 2023) - PV still covered over 94% of consumption though, so I can't really complain.
Best day was 29.55kWh (31.29kWh in 2023) - PV still covered over 94% of consumption though, so I can't really complain.
10x 405W JA Solar panels (4.05kWp) @ 5 degrees
3x 405W Longi panels (1.22kWp) @ 90 degrees
16.5kWh DIY LifePo4 battery
Solis inverter/charger
0.6kW Ripple WT
64kWh Kia E-Niro
3x 405W Longi panels (1.22kWp) @ 90 degrees
16.5kWh DIY LifePo4 battery
Solis inverter/charger
0.6kW Ripple WT
64kWh Kia E-Niro
Re: May 2024 generation
May 2024 was poor compared to 2023 at my company array - managed 1.469MWh in 2023, vs 1.216MWh this year.
Production - 1.216MWh
Self consumption - 760kWh (62%)
Export - 460kWh (38%)
Total Consumption - 2.98MWh
Import - 2.22MWh (75%)
Self consumption 760kWh (25%)
Production - 1.216MWh
Self consumption - 760kWh (62%)
Export - 460kWh (38%)
Total Consumption - 2.98MWh
Import - 2.22MWh (75%)
Self consumption 760kWh (25%)
Tesla Model 3 Performance
Oversees an 11kWp solar array at work
Oversees an 11kWp solar array at work
Re: May 2024 generation
I found some interesting data from the Met Office with a long history of bright sunshine hours for different regions of the country.
https://www.metoffice.gov.uk/research/c ... nal-series
On downloading the data for England-Midlands, and after analysing it becomes obvious why our solar panel generation is so variable from 1 year to the next.
May 2024 only achieved 82% of the average from the last 20 complete years.
Unlike the very sunny May 2020 during the 1st covid lockdown which achieved 150%. If only I had solar panels installed then.
Instead I get Dec 2023 at only 52% of average.
East Midlands
6x410W-East-Roof
10x410W-West-Roof
GivEnergy 5 kW Gen2 hybrid + 9.5 kWh battery
6x375W-South-Vertical
Solax 3.68 kW inverter
Zappi-Eddi
HI5-77 kWh
Ripple-PV-3kW/2900kWh-Wind-600W/1450kWh-UnderConstruction
6x410W-East-Roof
10x410W-West-Roof
GivEnergy 5 kW Gen2 hybrid + 9.5 kWh battery
6x375W-South-Vertical
Solax 3.68 kW inverter
Zappi-Eddi
HI5-77 kWh
Ripple-PV-3kW/2900kWh-Wind-600W/1450kWh-UnderConstruction

Re: May 2024 generation
Nowty Towers Power Station
Main 4kW PV system generated 502 kWh which is about 8% below baseline.
Total PV arrays generated 1673 kWh.
Electric Import was 786 kWh.
Gas import was 22 kWh.
Out of house EV charging was 90 kWh.
Petrol used in EV hybrid was 0 kWh.
Total imported energy use 898 kWh
Solar PV / Battery electric export was 1489 kWh.
Ripple GF wind farm generated 550 kWh which is a smidge above basline.
Total energy offset 2039 kWh
Net energy import/export (this month) for Nowty Towers 1141 kWh
Net Energy Import/export (cumulative this year 2024) for Nowty Towers 1945 kWh
19.6kW PV > 114MWh generated
Ripple 6.6kW Wind + 4.5kW PV > 34MWh generated
7 Other RE Coop's
105kWh EV storage
90kWh Home battery storage
40kWh Thermal storage
GSHP + A2A HP's
Rain water use > 530 m3
Ripple 6.6kW Wind + 4.5kW PV > 34MWh generated
7 Other RE Coop's
105kWh EV storage
90kWh Home battery storage
40kWh Thermal storage
GSHP + A2A HP's
Rain water use > 530 m3
Re: May 2024 generation
Similar to others, May was a long way down from last year and below PVGIS
Sunsynk system - 574kWh vs 625kWh PVGIS and 730kWh last year
Hoymiles man cave system - 131kWh
Sunsynk system - 574kWh vs 625kWh PVGIS and 730kWh last year
Hoymiles man cave system - 131kWh
Solar PV since July '22:
5.6kWp east/west facing
3.6kW Sunsynk hybrid inverter
2x 5.12kWh Sunsynk batteries
1.6kWp Hoymiles East/West facing PV on the man cave
Ripple DW 2kW
Ripple WB 200W
5.6kWp east/west facing
3.6kW Sunsynk hybrid inverter
2x 5.12kWh Sunsynk batteries
1.6kWp Hoymiles East/West facing PV on the man cave
Ripple DW 2kW
Ripple WB 200W