UK Wholesale Energy Market
(nowtythread for searching)
On another thread @Mart asked can somebody provide a lesson on UK wholesale prices and how they work ?
He was wondering why the live price he was seeing on the https://grid.iamkate.com site was jumping around. He also believed the price is closely linked to the gas generation price.
I thought it was worth starting a new thread as its quite a broad question and I'm trying to keep it simple. I’ve tried to find an online idiots guide, but have so far failed to find one good enough.
So I thought I would write up something up but remember folks, I am ONLY talking about wholesale prices and NOT retail prices. I will probably cover that later.
----------------------------------------------
Why does the leccy price track the gas generation price.
(From the Financial Times)
Why do wholesale power prices track gas prices ?
Pricing in Britain’s wholesale electricity market, like on the continent, is based on “short-run marginal costs”. Every electricity generator puts a bid in but the daily market price is set at the level that ensures there will be sufficient supply to meet demand. In other words, the price is always set by the most expensive plant — usually a fossil fuel-fired one — required that day.
In practice, this means gas-fired power plants, which still account for just under 40 per cent of Britain’s electricity supply, set the power price more than 80 per cent of the time, according to academics at University College London.
(From Good Energy which maybe a bit easier to understand)
So, how is gas setting the price ?
Gas sets the price of electricity, because the electricity price in every half hour period is set by the marginal cost of the last generating unit to be turned off to meet demand – which is invariably a gas power plant with high marginal costs.
----------------------------------------------
Why does the live leccy price appear to regularly oscillate.
Thats because your looking at the half hour balancing price which oscillates up at down throughout the day either side of the Day Ahead price.
(from www.elexon.co.uk)
How are the System Sell Price and the System Buy Price calculated ?
For each half hour trading period or ‘Settlement Period’, the ‘cash-out prices’ or ‘energy imbalance prices’ (System Sell Price and System Buy Price) will be calculated based on the cost incurred by National Grid – the System Operator – to bring the system into balance (based on accepted Balancing Mechanism Bids and Offers). The System Buy Price (SBP) is applied to BSC Parties that have negative imbalances and the System Sell Price (SSP) to those that have positive imbalances.
An example for today from the website @Mart was looking at,
https://grid.iamkate.com
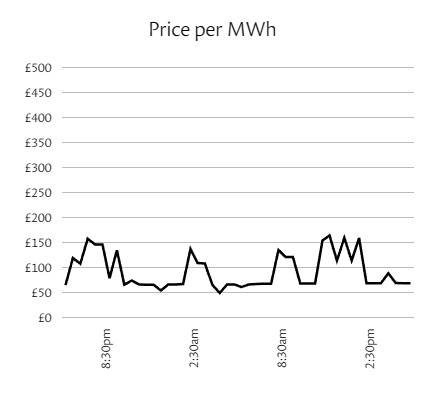
You will notice from the above graph the price oscillates above and below the day ahead price from yesterday which was £101 / MWh.
If you really want a hard read, look here, I gave up to be honest.
https://bscdocs.elexon.co.uk/guidance-n ... g-guidance
----------------------------------------------
What types of energy prices are there.
I look at this website which gives a good commentary about the days movements in prices.
https://zenergi.co.uk/market-watch/
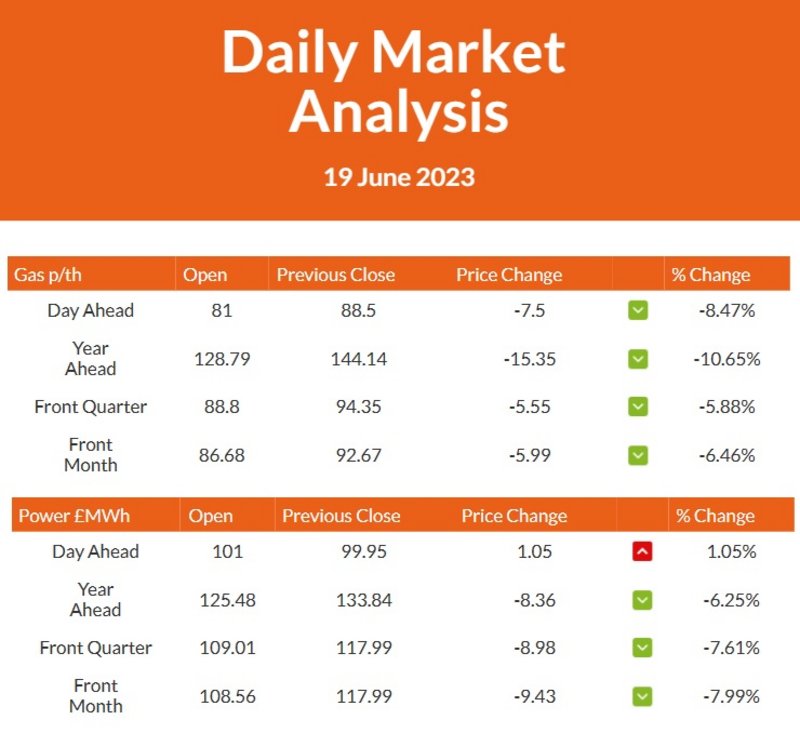
From yesterdays numbers,
What do these prices mean ?
As a market-traded commodity, leccy and gas doesn’t have just one price: buyers and sellers can enter into contracts hours, days, weeks, or months in advance.
Year Ahead Price – What the market thinks the worst case (good or bad) price of energy will be in a years time. In other words what generators are willing to take to offer power in a years time and what suppliers are willing to pay the generators in a years time. At this range there is little uncertainty about renewables as they generate an average (solar +/- 5% and wind +/- 10% on an annual basis). But there may be specific uncertainties, such as France’s nuke fleet is in trouble and we don't know how long its going to take to get fixed, Russia has cut off gas to Europe for the foreseeable future, China is buying up all the available LNG, etc. Used as a guide for agreeing annual PPA prices like the Ripple wind farms.
Day Ahead – Tomorrows price so mostly depends on the weather forecast, is it going to be windy, sunny, hot or cold. Also will depend upon gas availability, interconnector failures, Nuke breakdowns, or it could simply be the weekend or a bank holiday when there is generally less demand.
Front Month – This is the price for the block of the next calendar month, so today the Front Month will be for the month of July.
Front Quarter – This is for the block of the next calendar quarter so the next quarter will be for the block of July, Aug and Sep. But if todays date was 20th July the Front Quarter would be for the block of Oct, Nov, Dec (i.e, the quarter blocks are fixed on a calendar basis).
Now you might notice that the gas and leccy prices look numerically similar, in fact quite often they are the same. But the units are different because in the UK gas is priced in pence per therm and leccy is priced in pounds per MWh. I asked my energy trader friend why this was and he said its you crazy British people, I deal in Europe prices and both gas and leccy are all in Euros per MWh.
Note a therm of gas is approx 29.3 kWh (why do we do this to ourselves !).
https://en.wikipedia.org/wiki/Therm
So if we look at yesterdays Day Ahead prices of Gas and Leccy,
Day Ahead price of gas was 81p per therm, therefore 2.76p / kWh.
Day Ahead price of leccy was £101 per MWh or 10.1p / kWh.
So leccy today is 3.65 times the price of gas.
Gas plant efficiency is about 50% so that makes leccy 2x the price of gas. Then another 10% is lost in transmission so that makes leccy 2.2x the price of gas. But then you have to add on the capital cost of the gas plants, no idea what that is but it must make up some of the difference. Those efficiency numbers are an estimation but you get the idea.
Also note that the Front Month is a little higher than Day Ahead and Front Quarter is a bit higher than Front Month and Year Ahead is a lot higher, all because of increasing uncertainty the further into the future you go.
I'll do my next post regarding what the feck happened to energy prices over the past few years and why we went from almost consistent prices to crazy stuff. I know you can easily guess why, but I want to show the time line, plus why there have been big differences between Day Ahead vs Year Ahead and why this has really fecked us up based on how OFGEM regulation works.
Last edited by nowty on Mon Jul 03, 2023 7:40 pm, edited 1 time in total.
18.7kW PV > 109MWh generated
Ripple 6.6kW Wind + 4.5kW PV > 26MWh generated
5 Other RE Coop's
105kWh EV storage
60kWh Home battery storage
40kWh Thermal storage
GSHP + A2A HP's
Rain water use > 510 m3
Ripple 6.6kW Wind + 4.5kW PV > 26MWh generated
5 Other RE Coop's
105kWh EV storage
60kWh Home battery storage
40kWh Thermal storage
GSHP + A2A HP's
Rain water use > 510 m3
Re: UK Wholesale Energy Market
Thanks Nowty, that is very helpful.
Why do you think they still use the gas price to determine the electricity price when Europe doesn’t and they have much lower energy costs than we do?
Mitsubishi Ecodan
ASHP 8.5kW x 2
12 x 460w Solar panels
9.5kWh GivEnergy
Batteries x 2
EVs x 4 210 kWh Batteries
Ripple 5.8 kW PV 0.547 kW Whitelaw Brae
ASHP 8.5kW x 2
12 x 460w Solar panels
9.5kWh GivEnergy
Batteries x 2
EVs x 4 210 kWh Batteries
Ripple 5.8 kW PV 0.547 kW Whitelaw Brae
Re: UK Wholesale Energy Market
Can't thank you enough Nowty. Great to see that whilst gas generation prices largely dictate the wholesale price of leccy, it's not fixed, so to speak. Makes total sense that the price is effectively set by the providers of the last bit of power/energy.
No idea if that's fair, it seems somewhat unkind, but not sure how it would otherwise work. But does look like storage can nudge the price down a tad, as it would always want to discharge when prices are high, so would displace the highest priced supply (or some of it). Of course the loss of that small amount, of massively high priced sales, may be extremely hard on the FF generators, who probably rely ever more on it. Bit like the gas generation in Australia, before big batts started to be rolled out.
Am I right (or fair) to suspect that these prices are ripe for disruption as RE capacity and realtime power keep rising? So long, I suppose, as the amount of CCGT generation capacity on the grid, doesn't fall, and they keep fighting it out.
Fun times ahead.
8.7kWp PV [2.12kWp SSW + 4.61kWp ESE PV + 2.0kWp WNW PV]
Two BEV's.
Two small A2A heatpumps.
20kWh Battery storage.
Two BEV's.
Two small A2A heatpumps.
20kWh Battery storage.
Re: UK Wholesale Energy Market
The principal is still the same in Europe, if you look at the main European economies, the pattern of prices is very similar. Todays day ahead price of leccy in UK, France, Germany, Spain and Italy is all very similar at around 120 Euros per MWh or near 10 pence per kWh.
Remember I am talking wholesale prices and not retail prices as each country has dealt with retail prices in different ways. Mixing up the two leads to a lot of confusion and misinformation. I will add a later post about market reforms which will attempt to move all of Europe and the UK away from the gas prices.
Last edited by nowty on Wed Jun 21, 2023 12:35 pm, edited 1 time in total.
18.7kW PV > 109MWh generated
Ripple 6.6kW Wind + 4.5kW PV > 26MWh generated
5 Other RE Coop's
105kWh EV storage
60kWh Home battery storage
40kWh Thermal storage
GSHP + A2A HP's
Rain water use > 510 m3
Ripple 6.6kW Wind + 4.5kW PV > 26MWh generated
5 Other RE Coop's
105kWh EV storage
60kWh Home battery storage
40kWh Thermal storage
GSHP + A2A HP's
Rain water use > 510 m3
Re: UK Wholesale Energy Market
There will always be a fixed amount (assuming no change in capacity) of gas generation overheads, i.e. Capital asset costs and some revenue costs to pay the workforce to pay for whether the gas stations run or not. I say fixed, but increased interest rates will inevitably increase the capital cost of everything.
18.7kW PV > 109MWh generated
Ripple 6.6kW Wind + 4.5kW PV > 26MWh generated
5 Other RE Coop's
105kWh EV storage
60kWh Home battery storage
40kWh Thermal storage
GSHP + A2A HP's
Rain water use > 510 m3
Ripple 6.6kW Wind + 4.5kW PV > 26MWh generated
5 Other RE Coop's
105kWh EV storage
60kWh Home battery storage
40kWh Thermal storage
GSHP + A2A HP's
Rain water use > 510 m3
Re: UK Wholesale Energy Market
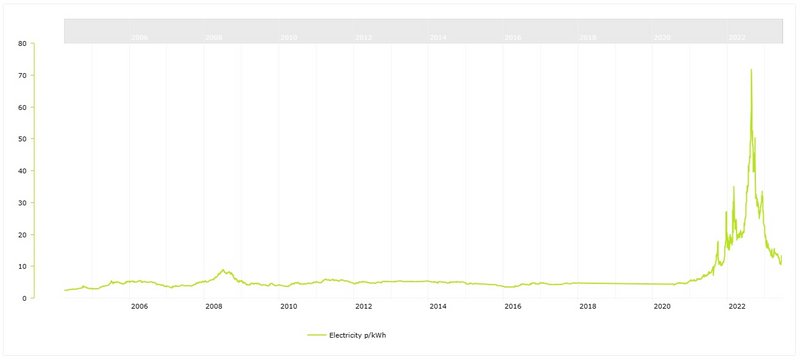
Have wholesale energy prices historically been volatile ?
To make things easier I’m going to concentrate on leccy as the graphs for gas or leccy are practically the same.
There was some temporary increase on around the time of the financial crisis in 2008. But then for over a decade nothing happened, you can see wholesale leccy traded at around 5p / kWh. Then from 2021 in the recovery from COVID, the global recovery led to a massive demand in energy with China buying up a lot of LNG from the middle east which pushed global prices of gas up which hits leccy prices as they follow gas. Prices climbed from 5p / kWh to around 20p / kWh by the end of 2021, before exploding during 2022 to as high as 70p / kWh because of the Ukraine invasion by Russia.
----------------------------------------------
Why did so many energy suppliers go bust ?
I believe around 50 UK energy suppliers collapsed. Suppliers buy their energy in the wholesale market. They can buy for hours, days, weeks, months or even years in advance. Prudent companies buy well in advance or use financial instruments to hedge in case of severe fluctuations in wholesale prices.
Unless the customer is on some form of tracker tariff, the supplier cannot just put its prices up. Many were on fixed deals or on the regulated price tariffs.
Some companies came into the market and realised that paying in advance is costly because you pay a premium for taking out the uncertainty of pricing. So, they just bought what their customers used and bought on the next day price which is generally cheaper than the longer term contracts. As the price never changed for a decade everyone was happy, customers got cut price deals, no one went bust, OFGEM was supposed to be regulating the companies but..................., no comment.
When wholesale prices rocketed, some companies went bust overnight as their banks pulled the plug. Some attempted to continue but failed to pay various levy fees to OFGEM and were sanctioned by OFGEM. Once that happened, their collapse was inevitable. As each one went bust OFGEM appoints a Supplier of Last Resort (SoLR) and there is a process which enables a SoLR to seek to recover additional costs they face in supplying these customers. These costs were then added onto the electricity standing charge which doubled it. Interesting to note that these costs are not added to gas standing charges, the reasoning is not everyone has mains gas.
----------------------------------------------
Deep dive into 2022/23 wholesale prices
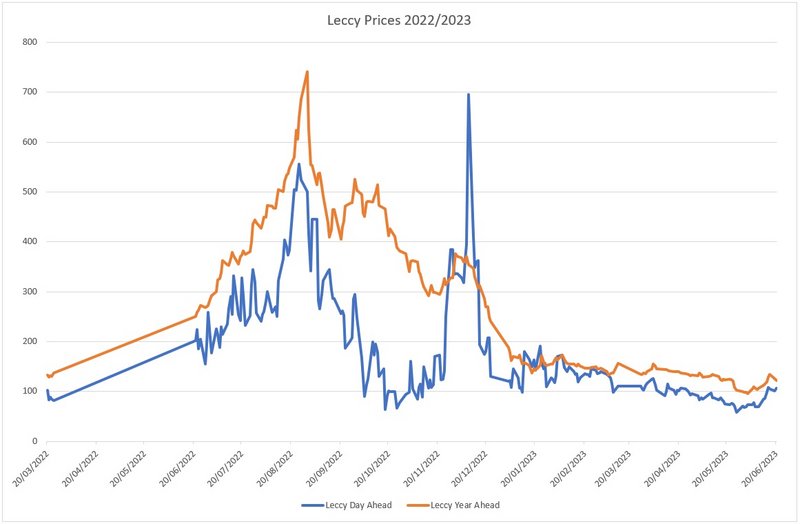
I took this data from the energy website I normally use and plotted it all on a graph. Both Day Ahead and Year Ahead are shown for leccy. If you don’t know what they mean go back to my first post on this thread. I have left off the gas prices but they follow the same pattern.
I want you to notice that at nearly all times, the Year Ahead price exceeds the Day Ahead price and around the autumn of 2022 the Year Ahead prices were like 4x the Day Ahead prices.
During the early summer of 2022 there was real concern about Russia cutting off gas to Europe and prices spiked. It was still flowing but at reduced rates and Russia kept coming up with various excuses why faults could not be fixed. Finally, it stopped altogether before the pipelines into Germany being blown up in Sept 2022. Europe did some analysis and realised that in an average winter and assuming no more gas from Russia would mean Europe was going to run out of gas by sometime in March 2022 unless consumption was reduced. And if it was a cold winter Europe would run out earlier. The Day Ahead price over the autumn of 2022 was as low as 10p / kWh because there was no issue about supply in the near term and there was no more panic about Russian gas as it had already stopped. But the dire consequence of Europe running out of gas in the future kept the Year Ahead prices high.
The Day Ahead price shot up towards the end of 2022 because there were a couple of cold snaps in the UK coupled with low wind speed. There was a crazy peak of Day Ahead leccy price on 09/12/22 but it was due to some exceptional conditions. As Europe’s winter was mild and consumption was reduced by 20%, Europe still had circa 25% storage capacity left by the end of the winter. Along with new gas terminals for LNG gas from the USA this caused prices of both Day Ahead and Year Ahead to drop and align more closely to around the current level around 10p / kWh. Thats still 100% up on historic values, but probably the new normal as Europe is now living on LNG.
----------------------------------------------
The OFGEM price cap process
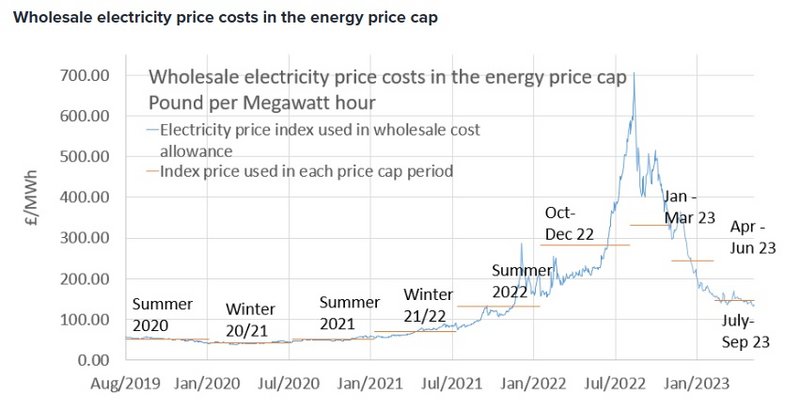
The wholesale element of the price cap is an average of the past 3 months of “forward looking energy contracts” (OFGEM words). The graph they show looks identical to the Year Ahead wholesale prices. During 2022 Year Ahead prices were at times abnormally higher than the Next Day prices as previously shown. This exacerbated the problem of feeding abnormally high prices through to the regulated price cap. As so many supply companies went bust the ones that remained had to buy more future contracts to prevent themselves from going bust if the prices continues to rise, but knowing these high prices would be passed on via the OFGEM process.
The fixed horizontal lines represent each average wholesale price element for the next price cap. It was changed from a 6 months average to a 3 months average in late 2022. You might notice that the first 3 month line does not look correct as an average of the 3 month period as it looks too low. Its because there was a transitional arrangement where this 3 month period also included the previous overlapping 3 months when prices were lower.
https://www.ofgem.gov.uk/publications/c ... lls-summer
I'll think about doing another post on the market reforms to decouple the wholesale leccy market from the marginal gas pricing.
18.7kW PV > 109MWh generated
Ripple 6.6kW Wind + 4.5kW PV > 26MWh generated
5 Other RE Coop's
105kWh EV storage
60kWh Home battery storage
40kWh Thermal storage
GSHP + A2A HP's
Rain water use > 510 m3
Ripple 6.6kW Wind + 4.5kW PV > 26MWh generated
5 Other RE Coop's
105kWh EV storage
60kWh Home battery storage
40kWh Thermal storage
GSHP + A2A HP's
Rain water use > 510 m3
Re: UK Wholesale Energy Market
Nowty
Has anything been decided on the market reforms, or are they still “talking” about what they propose to do?
Mitsubishi Ecodan
ASHP 8.5kW x 2
12 x 460w Solar panels
9.5kWh GivEnergy
Batteries x 2
EVs x 4 210 kWh Batteries
Ripple 5.8 kW PV 0.547 kW Whitelaw Brae
ASHP 8.5kW x 2
12 x 460w Solar panels
9.5kWh GivEnergy
Batteries x 2
EVs x 4 210 kWh Batteries
Ripple 5.8 kW PV 0.547 kW Whitelaw Brae
-
- Posts: 2063
- Joined: Wed Jun 02, 2021 6:10 pm
Re: UK Wholesale Energy Market
They haven't even decided what to do about how storage is charged (currently paying to use the grid on both import and export, which makes it unviable) and that is just a simple change to encorage something that the grid and the country all need!
They seem to be paralysed, can't make any decision - maybe for fear of upsetting their friends who are milking things as they are at the moment?
I don't expect anything to change.
A
2.0 kW/4.62 MWh pa in Ripples, 4.5 kWp W-facing pv, 9.5 kWh batt
30 solar thermal tubes, 2MWh pa in Stockport, plus Congleton and Kinlochbervie Hydros,
Most travel by bike, walking or bus/train. Veg, fruit - and Bees!
30 solar thermal tubes, 2MWh pa in Stockport, plus Congleton and Kinlochbervie Hydros,
Most travel by bike, walking or bus/train. Veg, fruit - and Bees!
-
- Posts: 662
- Joined: Mon Mar 21, 2022 7:37 pm
Re: UK Wholesale Energy Market
Is there any reason, other than encouraging the deployment of storage, why they shouldn't pay the grid operator bot times they use the connection?AE-NMidlands wrote: ↑Thu Jun 22, 2023 9:04 am
They haven't even decided what to do about how storage is charged (currently paying to use the grid on both import and export, which makes it unviable) and that is just a simple change to encourage something that the grid and the country all need!
What happens with the import-export part of domestic generation and storage, does the DNO only charge for the import?
Morso S11
FIT
16 Sharp PV panels facing WSW 4kW
Solarmax 4200S inverter
Non FIT
3 Canadian solar DC coupled 1.75kW facing SSE
Storage
Growatt SPA3000TL BL inverter ac coupled
Growatt GBLI6532 6.5kWh lithium phosphate battery
FIT
16 Sharp PV panels facing WSW 4kW
Solarmax 4200S inverter
Non FIT
3 Canadian solar DC coupled 1.75kW facing SSE
Storage
Growatt SPA3000TL BL inverter ac coupled
Growatt GBLI6532 6.5kWh lithium phosphate battery
Re: UK Wholesale Energy Market
The Gov needs to be very careful in its reforms. Basically they are playing with the law of supply and demand to protect the customer and hence them voting them out.
They need to look forward as the scene is going to be very different in the future eg imagine all the EVs with V2G and the peaks and troughs of solar and wind.
I am not sure that the present system is broke and needs fixing after all it does give us what could be the most reliable system in the world.