Found this on LinkedIn.
Batteries are re-shaping the solar duck curve, soaking up solar during the day and discharging it when it's needed in the evening.
The grid that originally coined the term "duck curve" is showing how to fix it. Just install more batteries!
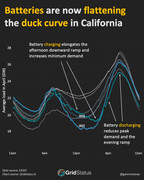
Underlying data taken from this interactive website where it looks like you can build your own graphs/reports .
https://www.gridstatus.io/live/caiso
Flattening the duck curve with batteries
Tesla Model 3 Performance
Oversees an 11kWp solar array at work
Re: Flattening the duck curve with batteries
Nice one dan, real world difference maker. California has a good year round climate I think?
16.6kW PV SE, VI, HM, EN & DW
Ripple 7kW WT & Gen to date 11MWh
42kWh LFPO4 storage
95kWh Heater storage
12kWh 210ltr HWT.
73kWh HI5
Deep insulation, air leak ct'd home
Zoned GCH & Hive 2
WBSx2
Low energy bulbs
Veg patches & fruit trees
Ripple 7kW WT & Gen to date 11MWh
42kWh LFPO4 storage
95kWh Heater storage
12kWh 210ltr HWT.
73kWh HI5
Deep insulation, air leak ct'd home
Zoned GCH & Hive 2
WBSx2
Low energy bulbs
Veg patches & fruit trees