Mart wrote: ↑Mon Jan 22, 2024 8:48 am
Something I've noticed! When wind gen is really high, I see it drop overnight then rise again in line with demand. I've always assumed this is curtailment, but have also heard that wind gen is highest in the evening and morning.
I see this image on Nat Grid live for last night/this morning:
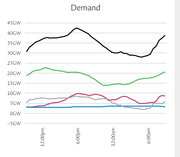
With demand in black and wind in green. The wind and demand curves do match (again) but the demand is so high, and the margin between the two larger than usual, that I wonder if this is curtailment or wind gen dropping? Perhaps it's curtailment due to a drop in demand in areas where the wind gen can be moved too?
[Edit - Just to add, the typical wind gen curve I see in these examples is approx 20GW evening, sliding down to 15GW overnight, then back up to 20GW in the morning. So very similar to last night.]
Can anyone educate me further please?
I think last night with storm Isha was an extreme rare event so probably not a good example of what happens typically. So you know the grid cannot (yet) run on renewables alone so we need some spinning reserve from Gas, Nuclear, Biomass, etc, to stabilise the grid. Typically the grid curtails wind at night to keep around 3GW of gas generation running. Exporting on the interconnectors is one way to reduce that curtailment as it adds to our demand.
All things (weather-wise) being equal the wind (especially on land) tends to be lower at night so that naturally drops the wind generation. This is because air is sticky, so air near the ground does not like to move because of friction with the ground. In the daytime we get thermal activity from the land being heated by the sun and makes the air less dense and thermals stir up the air so there is higher connection with the stronger winds higher up and that drags the air along lower down more. (I note Ken also alluded to this)
Last night was totally different and very rare as it was storm force everywhere at once. So the priority was grid stability, your going to have trees hitting transmission lines, wind farms shutting down due to excess wind speeds, turbulence or running on reduced power with high blade angles. I noticed the large Scottish Whitelee wind farm was down, Hornsea 1 was on low output whilst its sister Hornsea 2 was flat out. The benchmarking windfarm next to Graig Fatha was at 30% whilst Graig Fatha was flat out but even Graig Fatha shutdown at least once last night for a short time.
Gas was about 7GW to 9GW all night so higher than normal for a windy night. Wind power dropped during the strong winds between 9pm and 3am so part curtailment, part shutdown or purposely running on low power with feathered blades to protect them.
Today is now different, good strong generating winds, we are exporting on all interconnectors and we are 1GW away from a wind record so look out at 6pm tonight and tomorrow.
Hope that make some sense.

